Tutorial
This tutorial assumes you have a cluster up and running. Follow the guide in Installation if you don’t have a test cluster.
This tutorial walks through a set of common usage patterns to get you started quickly. We’ll use the Google microservices demo (aka Online Boutique aka Hipstershop) as an example application.
See Configuration for a complete summary of the ways in which Voithos can be configured using the VoithosAutoscalingGroup CRD.
Test Application
Demo Manfiests
First, install the onlineboutique application. You can view the manifests here.
kubectl create ns onlineboutique1
kubectl -n onlineboutique1 apply -f https://raw.githubusercontent.com/virtexlabs/examples/main/onlineboutique/onlineboutique.yaml
This installs the following workloads into your cluster:
kubectl get all -n onlineboutique1

NAME                            TYPE        CLUSTER-IP       PORT(S)
service/adservice               ClusterIP   10.100.86.90     9555/TCP
service/cartservice             ClusterIP   10.101.192.37    7070/TCP
service/checkoutservice         ClusterIP   10.102.158.248   5050/TCP
service/currencyservice         ClusterIP   10.110.162.61    7000/TCP
service/emailservice            ClusterIP   10.102.73.26     5000/TCP
service/frontend                ClusterIP   10.97.50.200     80/TCP
service/paymentservice          ClusterIP   10.109.187.214   50051/TCP
service/productcatalogservice   ClusterIP   10.110.108.126   3550/TCP
service/recommendationservice   ClusterIP   10.99.24.127     8080/TCP
service/redis-cart              ClusterIP   10.102.130.80    6379/TCP
service/shippingservice         ClusterIP   10.108.199.190   50051/TCP

NAME                                    READY
deployment.apps/adservice               1/1
deployment.apps/cartservice             1/1
deployment.apps/checkoutservice         1/1
deployment.apps/currencyservice         1/1
deployment.apps/emailservice            1/1
deployment.apps/frontend                1/1
deployment.apps/loadgenerator           1/1
deployment.apps/paymentservice          1/1
deployment.apps/productcatalogservice   1/1
deployment.apps/recommendationservice   1/1
deployment.apps/redis-cart              1/1
deployment.apps/shippingservice         1/1
Install HPAs
Next, we’ll attach a variety of HPAs to the online boutique workloads in order to see how Voithos interacts with the various HPA metric and target types.
kubectl -n onlineboutique1 apply -f https://raw.githubusercontent.com/virtexlabs/examples/main/onlineboutique/hpa.yaml
We’ll also install a few KEDA-managed HPAs to demsonstrate how Voithos interacts with KEDA’s ScaledObject API.
kubectl -n onlineboutique1 apply -f https://raw.githubusercontent.com/virtexlabs/examples/main/onlineboutique/hpa-keda.yaml
Install Voithos
Next, install Voithos in your cluster using the Installation instructions as a guide.
Configure Voithos
Once Voithos is installed, we can create autoscaling groups to configure Voithos. When you install Voithos there are two voithosautoscalinggroup custom resources that get created automatically. You can run the following command to view them.
kubectl get voithosautoscalinggroup -A -o yaml
The voithos-default autoscaling group is the cluster-wide default that each workload is initially assigned to upon installation. Notice that none of the enablePatching fields have overriden from the default CRD value of false, and so by default Voithos does not apply patches. Resources in the voithos-system namespace, which are autoscaled and patched according to the settings in the voithos-system autoscalinggroup, are the only resources with patching enabled by default when you install Voithos.
Now lets configure Voithos to autoscale the microservices deployed in our online boutique application and walk through each part of the configuration. The VoithosAutoscalingGroup manifests can be found here.
kubectl -n onlineboutique1 apply -f https://raw.githubusercontent.com/virtexlabs/examples/main/onlineboutique/asg.yaml
Workload Selection
The workload selection rule that we’ve specified selects all workloads of kind=Deployment in .metadata.namespace=onlineboutique1 with .metadata.name!="redis-cart".
spec:
  selector:
    kinds:
    - "Deployment"
    namespaces:
      operator: In
      values:
      - "onlineboutique1"
    workloads:
      operator: NotIn
      values:
      - "redis-cart"
Selection Rule Validation
Note: it can take up to 5 minutes for the Voithos controller to pick up newly created autoscaling group objects. See the Configuration for more information about workload selection.
Next we need to check on the newly created autoscaling groups to validate the selection rules are grouping workloads properly. First, port-forward into Voithos’ internal API:
kubectl port-forward -n voithos-system svc/api 8081:80 &>/dev/null &
To demonstrate how the selector validation process works, we’ll create an autoscaling group (link to manifests) that intentionally collides with a subset of the workloads captured by the autoscalinggroup that we just created above, and then walk through the debugging process.
kubectl -n onlineboutique1 apply -f https://raw.githubusercontent.com/virtexlabs/examples/main/onlineboutique/asg-collision.yaml
First we check to see if our newly created resources have any collisions.
curl -s http://localhost:8081/autoscalinggroups/onlineboutique | jq '.status.numCollisions' && \
curl -s http://localhost:8081/autoscalinggroups/onlineboutique-collision | jq '.status.numCollisions'

0
1
The onlineboutique autoscalinggroup is collision free and thus valid, while the onlineboutique-collision autoscalinggroup references two workloads already assigned to another group, and is thus ignored by the controller. Let’s inspect the status.collisions field in the offending resource:
curl -s http://localhost:8081/autoscalinggroups/onlineboutique-collision | jq `.status.collisions`

{
  "Deployment.onlineboutique1.emailservice": "onlineboutique",
  "Deployment.onlineboutique1.frontend": "onlineboutique"
}
We can see that the collisions refer to the frontend and emailservice deployments in the onlineboutique1 namespace, which are already assigned to a voithosautoscalinggroup with name onlineboutique. If we now inspect the workload selectors in these two autoscaling groups, it’s clear that they both capture the frontend and emailservice deployments.
The next step in the debugging process would be to update the selection rules in onlineboutique-collision and rerun the above commands to ensure that the collisions were resolved.
Tip: It’s generally a good idea to deploy an autoscaling group with patching disabled to validate the selection rule before allowing Voithos to patch resources.
Patch Schedule
In the onlineboutique voithosautoscalinggroup, we specify that we want Voithos to generate recommendations that can be applied every 60 minutes, and that Voithos should apply out-of-cycle patches if a workload suddenly becomes severely under or overprovisioned. Note that the spec.configuration.schedule field values do not grant Voithos license to apply patches; patching must be enabled granularly within the subfields of spec.configuration.resources (detailed in next sections).
spec:
  configuration:
    patching:
      schedule: "1h"
      allowReactiveUpdates: true
Container Resources Configuration
Next we want to configure how Voithos sets container resources for each of these microservices. We’ll apply the following set of rules to all containers:
- CPU requests patching enabled within the range of 10-2000 millicores, and a target utilization of 80%.
- CPU limits patching enabled with a minimum value of 50 millicore, and a target limit-requests ratio of 3.0.
- Memory requests patching enabled within the range of 50-4000 mebibytes, and with a value set to the 99th percentile of the memory consumption with an additional 30% buffer.
- Memory limits patching enabled with a minimum value of 250 mebibytes, and a target limit-requests ratio of 3.0.
This logic is expressed as follows:
spec:
  configuration:
    resources:
      containers:
      - resources:
          requests:
            cpu:
              enablePatching: true
              min: 10m
              max: "2"
              target:
                utilization: 80
            memory:
              enablePatching: true
              min: 50Mi
              max: 4Gi
              target:
                percentile: 99
                bufferPercentage: 30
          limits:
            cpu:
              enablePatching: true
              min: 50m
              target:
                requestsRatio: 3.0
            memory:
              enablePatching: true
              min: 250Mi
              target:
                requestsRatio: 3.0
Notice that the spec.configuration.containers[0].name field is ommitted; this serves as a wildcard capture on the name field of the Kubernetes container, and thus our configuration will apply to all containers in the workloads caputured by our workload selection rule.
Horizontal Pod Autoscaler Configuration
Now that we’ve configured Voithos to optimize container resources, let’s discuss the interplay between a container resource, an associated HPA metric target, and the corresponding fields in the VoithosAutoscalingGroup configuration.
Let’s first get a list of HPAs that are horizontally scaling the onlineboutique microservices.
kubectl get hpa -n onlineboutique1 -A

NAMESPACE         NAME                       REFERENCE                          TARGETS                   MINPODS   MAXPODS   REPLICAS
onlineboutique1   adservice                  Deployment/adservice               82%/80%                   1         4         4
onlineboutique1   frontend                   Deployment/frontend                58%/80%                   1         10        4
onlineboutique1   keda-hpa-currencyservice   Deployment/currencyservice         38033408/200Mi, 53%/60%   1         10        6
onlineboutique1   keda-hpa-emailservice      Deployment/emailservice            46%/50%                   1         5         5
onlineboutique1   keda-hpa-paymentservice    Deployment/paymentservice          48%/70%, 35%/70%          1         3         2
onlineboutique1   onlineboutique             Deployment/productcatalogservice   53%/80%                   2         4         3
onlineboutique1   shippingservice            Deployment/shippingservice         513512/1024k              1         5         1
We configure how Voithos interacts with these HPAs using the spec.configuration.resources.horizontalPodAutoscalers field of the VoithosAutoscalingGroup. In the previous section we configured Voithos to vertically scale cpu and memory requests according to a specific set of rules, but if an HPA is present, Voithos cannot blindly follow that prescription without taking the HPA’s reaction into account, because there is a feedback loop between the vertical sizing of the container, and the metric(s) that the HPA is scaling on. This feedback loop is particularly pronounced when the HPA metric has spec.metrics[].type="ContainerResource|Resource"; in these cases the metric is either directly derived from the container requests (when the HPA metric has .target.type="Utilization"), or constrained by the requests (when the HPA metric has .target.type="AverageValue"). The severity of this feedback for custom HPA metrics (i.e., spec.metrics[].type="External|Object|Pods") varies according to the degree of correlation between the HPA target metric value and the container’s resource utilization; in general container requests and HPA metrics cannot be treated as independent, and must be optimized jointly. To handle this, Voithos holistically optimizes the vertical and horizontal scaling, and then works alongside the HPA to impart the changes.
If your HPA is scaling on custom metrics only, then no further configuration is required (though Voithos will take them into account). For Resource and ContainerResource metrics, you’ll need to decide if you want the existing HPA utilization (for .target.type="Utilization") or average value (for .target.type="AverageValue") target to be patched. If you want the HPA target metric to be honored, then there is no need to define rules in spec.configuration.resources.containers[] for the workload in question because those settings will be igonored; you’re instructing Voithos to size the container in a way that minimizes the delta between the current metric value and the target specified in the HPA. If patching is enabled, Voithos will derive a target value based on the requests computed from the rule specified in spec.configuration.resources.containers[], subject to any constraints that you place on it via the spec.configuration.resources.horizontalPodAutoscalers[].metrics[].<resource|containerResource>.<averageUtilization|averageValue>.<min|max> field of the voithosautoscalinggroup (Voithos applies these bounds to a constrained optimization problem rather than naively clipping the value after the fact).
Let’s now translate the HPA configuration rules we’ve specified in the onlineboutique voithosautoscalinggroup into words:
- For the
keda-hpa-currencyserviceHPA- Enable CPU target utilization patching for HPA metrics of type
ResourceandContainerResource - Disable Memory target average value patching, with a minimum recommended value of 100 mebibytes.
- Enable CPU target utilization patching for HPA metrics of type
- For all other HPAs
- Enable CPU target utilization patching for HPA metrics of type
ResourceandContainerResource, with a minimum value of 40%. - Enable Memory target utilization patching for HPA metrics of type
ResourceandContainerResource, with a minimum value of 30%.
- Enable CPU target utilization patching for HPA metrics of type
This logic is expressed as follows:
spec:
  configuration:
    resources:
      horizontalPodAutoscalers:
      - name: "keda-hpa-currencyservice"
        metrics:
        - type: Resource
          resource:
            name: "cpu"
            target:
              type: Utilization
              averageUtilization:
                enablePatching: true
        - type: ContainerResource
          containerResource:
            name: "memory"
            target:
              type: AverageValue
              averageValue:
                enablePatching: false
      - metrics:
        - type: Resource
          resource:
            name: cpu
            target:
              type: Utilization
              averageUtilization:
                enablePatching: true
                min: 40
        - type: ContainerResource
          resource:
            name: cpu
            target:
              type: Utilization
              averageUtilization:
                enablePatching: true
                min: 40
        - type: Resource
          resource:
            name: memory
            target:
              type: Utilization
              averageUtilization:
                enablePatching: true
                min: 30
        - type: ContainerResource
          resource:
            name: memory
            target:
              type: Utilization
              averageUtilization:
                enablePatching: true
                min: 30
Refer to the Configuration and Reference Docs for more information about using the VoithosAutoscalingGroup custom resources to configure Voithos, or reach out to us directly.
Monitor Applications
Voithos installs with a dashboard for you to monitor your resources and autoscaling recommendations at the cluster, namespace, workload, and container levels. The dashboard exposes an internal service which you can access in anyway that fits your needs. For the sake of demonstration let’s just port-foward:
kubectl port-forward -n voithos-system svc/grafana 3000:3000
You can then view your dashboard here http://localhost:3000.
Cluster View
This dashboard provides top-level view of the resources being consumed and requested in your cluster. It has panels for CPU, memory, Pods, and nodes.
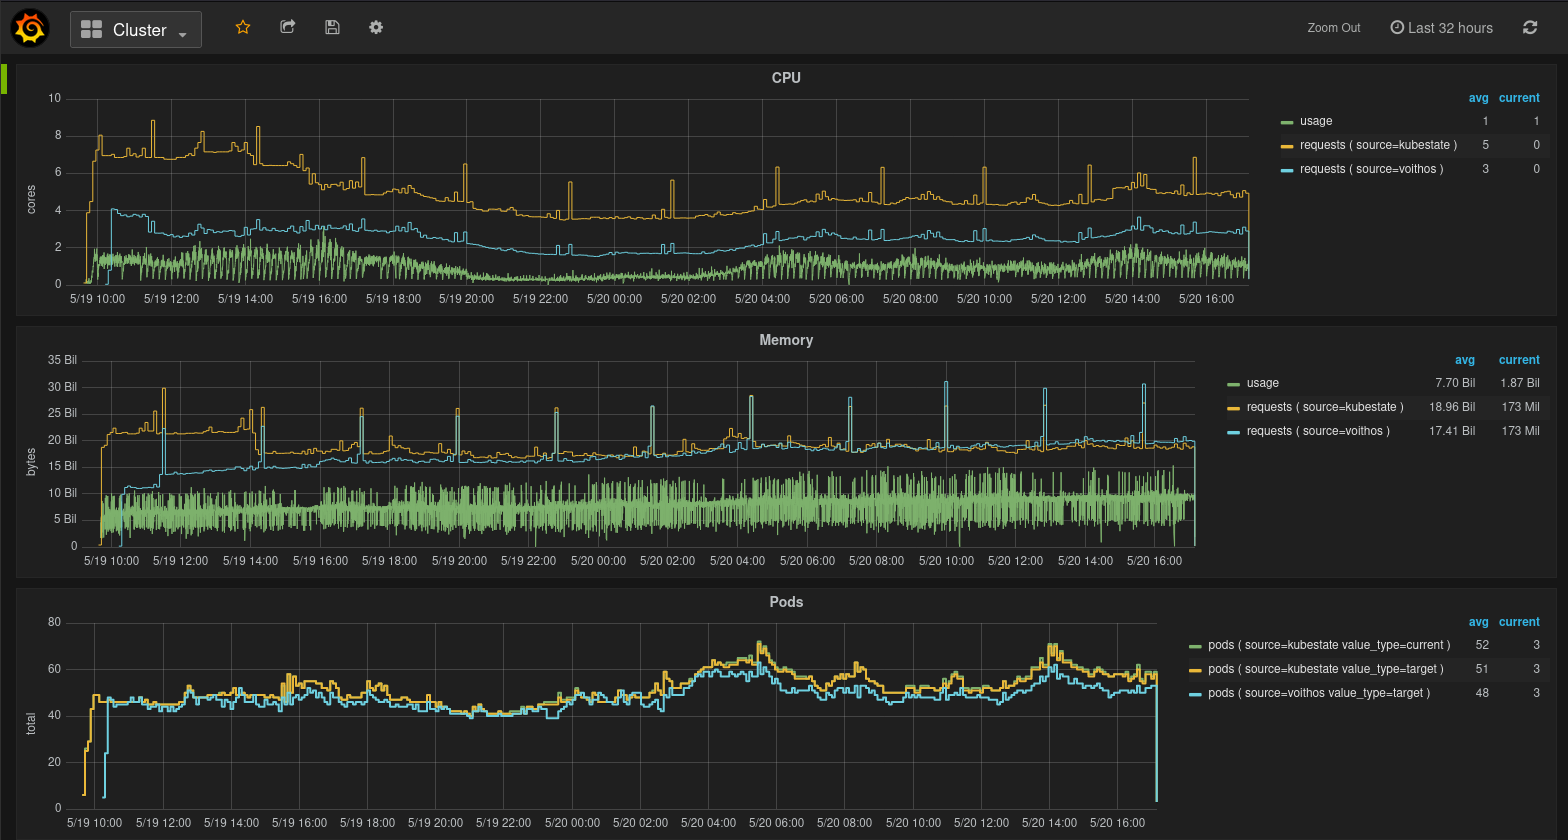
Fig.1 Cluster view in the Voithos dashboard
In most cases, directly comparing the aggregate CPU requests from kubestate metrics with those recommended by Voithos will be misleading, because of the fact that not all workloads will have requests set.
Namespaces View
This dashboard provides a top-level view of the resources being consumed and requested in a particular namespace of interest. It has panels for CPU, memory, and Pods.
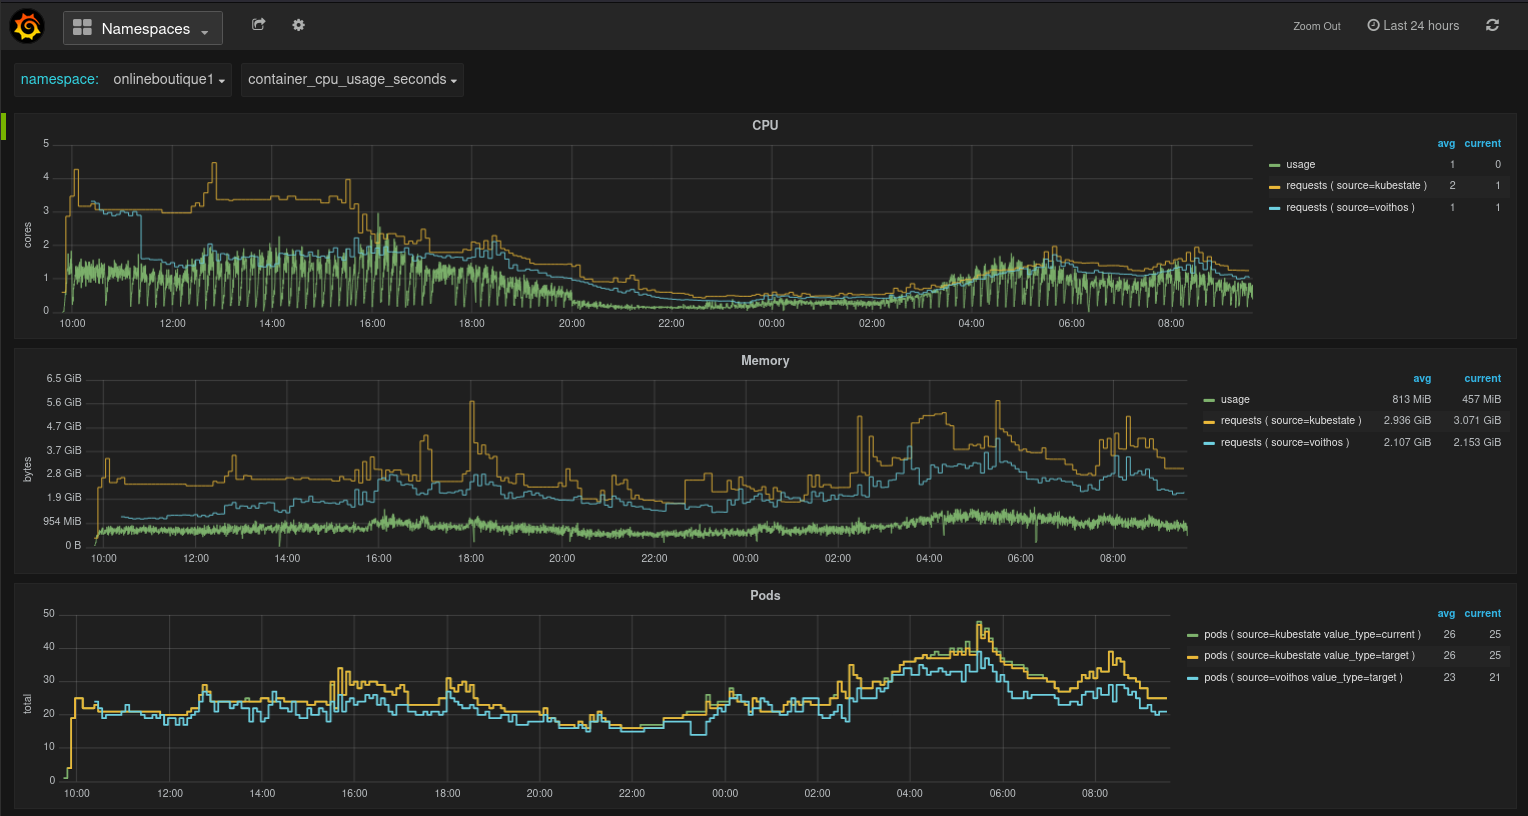
Fig.2 Namespaces view in the Voithos dashboard
In most cases, directly comparing the aggregate CPU requests from kubestate metrics with those recommended by Voithos will be misleading, because of the fact that not all workloads will have requests set.
Workloads View
This dashboard gives you workload-level view of the resources being consumed and requested by a particular workload. It provides panels for CPU, memory, Pods, and HPA target Utilization and AverageValue metrics. The CPU and memory usage data represent usage across all containers in the workload, while each requests and limits data point represents the requests aggregated over all containers in the workload multiplied by the number of Pod replicas at that point in time. The number of replicas is set to .spec.replicas for source=kubestate, and to the optimized replicas for source=voithos.
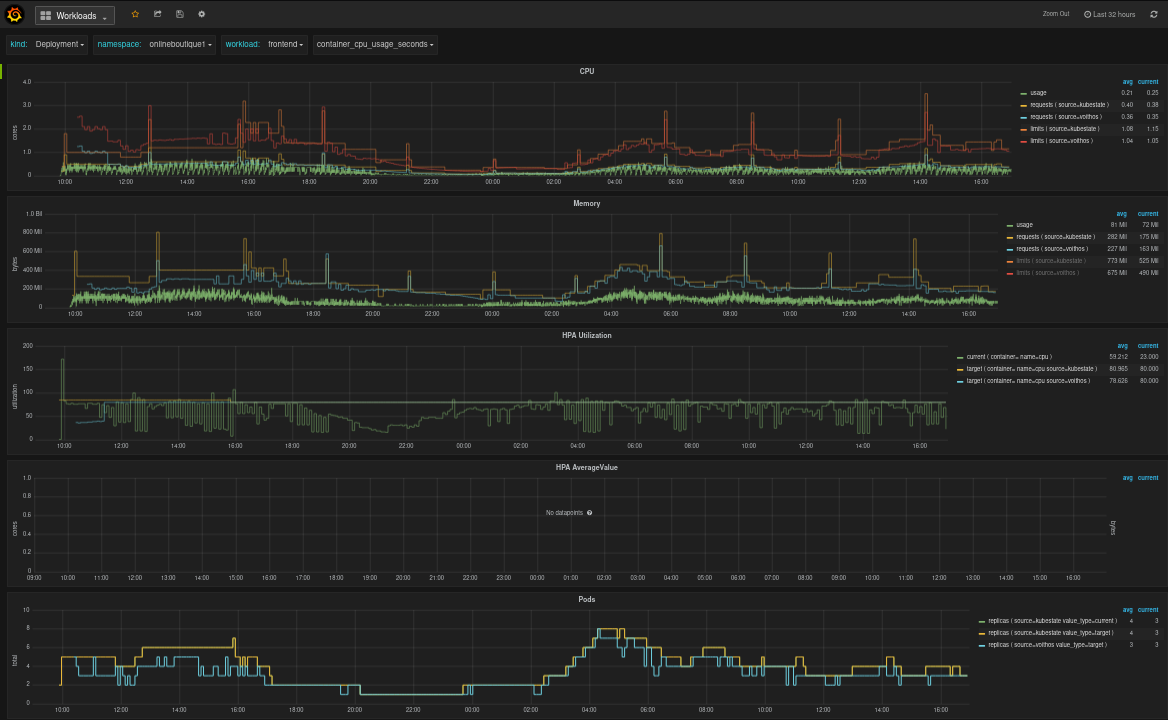
Fig.3 Workloads view in the Voithos dashboard
Containers View
This dashboard provides a granular view of the resources being consumed by individual containers within a workload. It has panels for CPU, memory, and Pods. The usage data shown in the CPU and memory panels represent raw container metric data collected from cAdvisor.
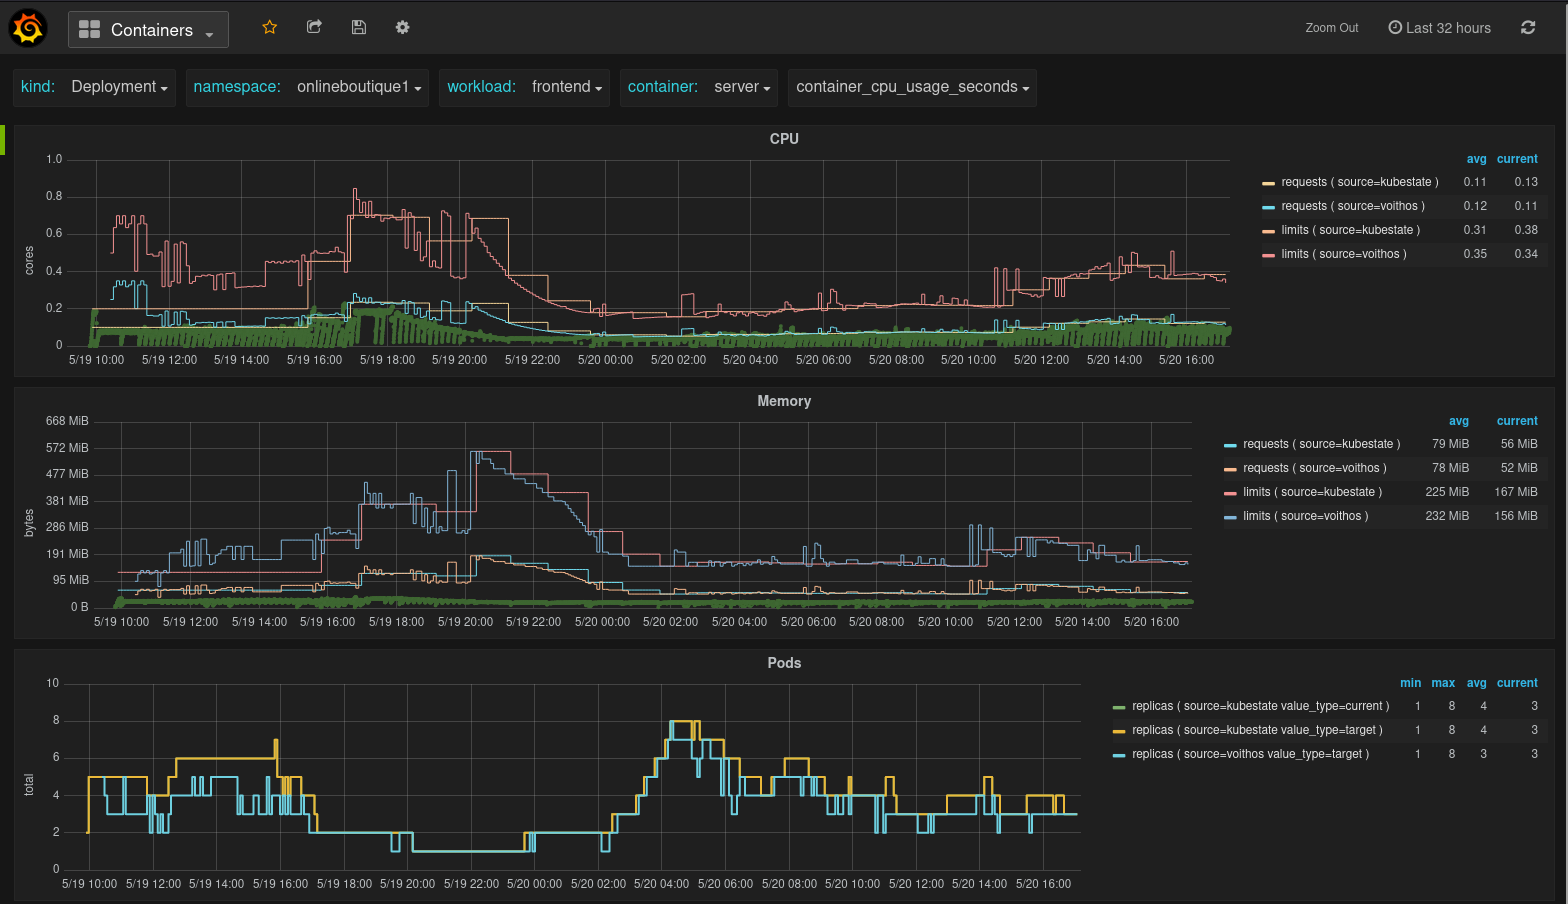
Fig.4 Containers view in the Voithos dashboard